
htop vs btop vs vtop vs ptop: features and a local benchmark
I made ptop, a Rust copy of vtop, because I liked the dots and wanted the monitor itself to use fewer resources. That makes me a very interested party in this comparison. It also means I owe you the measurements, including the ones that make another tool look good.
My starting recommendation: htop for working through a process list; btop for a broader system dashboard; vtop for the original dotted interface; ptop if you want that interface in Rust. The right choice depends on what you need to see.
Update: ptop 0.1.3 is now available. A separate test measured 68–71% less CPU than ptop 0.1.2. The four-tool tables below still describe 0.1.2; I have not rerun all four tools against 0.1.3. See the collector update for the new results.
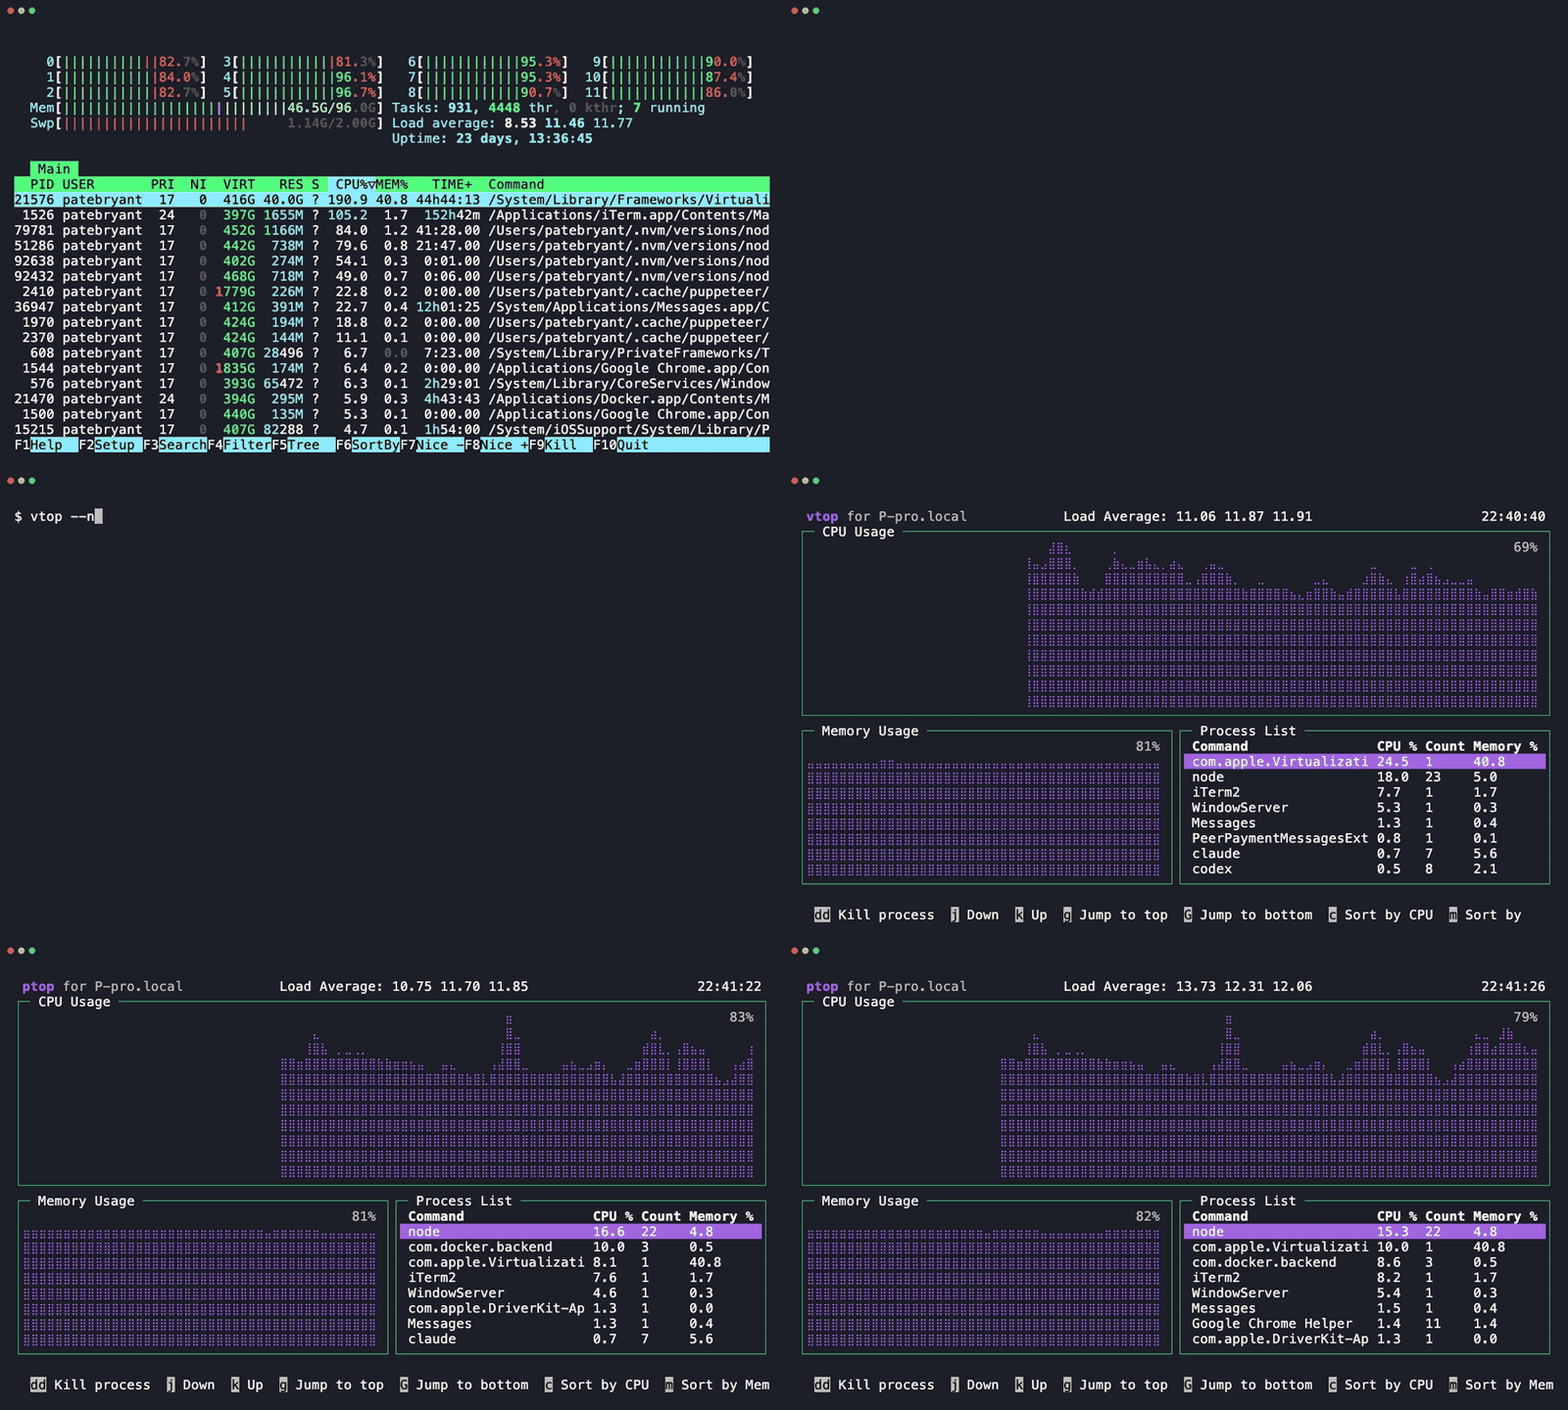
Live interface previews, recorded separately from the benchmark below.
What each monitor is good at
htop: investigate individual processes
htop is the one I'd reach for when I want to search a command line, filter a busy process list, inspect a parent/child tree, or change a process's priority. Its columns and meters are configurable. The htop 3.2.2 manual documents these controls and which process fields depend on the platform.
It is written in C and uses ncurses. Linux and macOS are supported, although not every metric is available on both. Its process-focused view is a useful reason to choose it regardless of how a memory benchmark turns out.
btop: keep the whole machine in view
btop puts CPU, memory, disks, network activity, and processes in one dashboard. It also offers a process tree, filtering, detailed process information, mouse controls, and themes. If you're investigating whether the bottleneck is the CPU, storage, or network, those extra panels are useful.
The btop 1.4.7 documentation describes the C++ implementation and Linux/macOS support. Some capabilities depend on the platform and build; for example, its documented GPU monitoring support has Linux-specific requirements. More panels also mean this is doing different work from vtop or ptop.
vtop: the original dots and grouped processes
vtop draws CPU and memory history using Unicode braille characters and groups processes with the same name. That grouping is different from the parent/child tree you get in htop or btop. It is handy when you want a compact view of several copies of the same program.
vtop runs on Node.js and installs through npm. It has themes, keyboard navigation, and mouse selection. The upstream README documents the controls, including an important detail: dd targets all processes in the selected group. The interface deserves the credit for why ptop exists.
ptop: the vtop interface, rebuilt in Rust
ptop means Pate's top. The goal is to preserve vtop's dots, grouping, controls, and themes while reducing overhead. It is a native Rust executable; npm distributes the binary rather than keeping a Node wrapper running.
It doesn't add btop's disk/network dashboard or turn the grouped list into htop's process tree. It also has deliberate differences from vtop: its own name, no old footer link, and manual updates. Compatibility tests cover specific frames and behaviors, not every possible terminal and workload. The ptop introduction covers those details and the earlier vtop-only benchmark.
| Tool | Main reason to choose it | Process view | Implementation |
|---|---|---|---|
| htop | Search, filter, and manage processes | Individual processes and tree | C + ncurses |
| btop | CPU, memory, disk, and network dashboard | Individual processes and tree | C++ |
| vtop | Original dotted CPU/memory graphs | Same-name groups | JavaScript + Node.js |
| ptop | Familiar vtop behavior in Rust | Same-name groups | Rust native executable |
This is a comparison of the tools' focus, not an exhaustive capability matrix. In particular, htop has configurable meters and platform-dependent I/O fields; choosing btop for its dashboard doesn't mean htop cannot display any I/O information.
ptop 0.1.3: a separate collector update
I reduced macOS memory-collection overhead while keeping the 200 ms memory schedule, two-second process schedule, metric arithmetic, and terminal behavior. Four alternating 30-second old/new pairs at each interface refresh measured:
| Interface refresh | ptop 0.1.2 median CPU | ptop 0.1.3 median CPU | Reduction |
|---|---|---|---|
| 300 ms, default | 22.55% | 7.24% | 67.91% |
| 1,000 ms | 24.61% | 7.23% | 70.62% |
CPU includes reaped sensor children, with 100% equal to one core. Median own-process RSS stayed similar: 9.19 → 9.25 MiB at 300 ms and 9.02 → 8.86 MiB at 1,000 ms. The planned below-7% median target was missed at both intervals.
This used the same Mac and terminal dimensions described below, but it was a separate experiment. Do not combine these numbers with the earlier vtop, htop, or btop results to calculate a new ranking or speedup. htop and btop have not been retested against 0.1.3. The full collector report and raw old/new measurements include ranges, reproduction, compatibility checks, and limitations. A later direct ptop versus vtop test compares the current release with vtop separately.
Earlier four-tool benchmark: ptop 0.1.2
htop used the least CPU; ptop had the lowest own-process RSS. btop used much less CPU than either dotted monitor while providing a broader dashboard. ptop improved on vtop's CPU and memory overhead in this experiment, but it was not the CPU winner.
These are medians and observed minimum–maximum ranges across four successful 30-second runs per tool, measured on October 7, 2026. A range here describes the four observed runs; it is not a confidence interval.
CPU overhead
| Tool | Median CPU | Run range |
|---|---|---|
| htop 3.2.2 | 0.31% | 0.31–0.33% |
| btop 1.4.7 | 2.37% | 2.34–2.42% |
| vtop 0.6.1 | 24.68% | 24.45–24.96% |
| ptop 0.1.2 | 20.70% | 20.10–21.17% |
CPU is expressed as a percentage of one core, including startup, shutdown, and reaped sensor children. Lower is better for the overhead being measured. The tools' own CPU displays can use different normalization, so these values should not be read as screenshots of their interfaces.
Own-process memory
| Tool | Median own RSS | Range |
|---|---|---|
| htop 3.2.2 | 9.97 MiB | 9.68–11.03 MiB |
| btop 1.4.7 | 19.18 MiB | 18.95–20.78 MiB |
| vtop 0.6.1 | 112.22 MiB | 110.82–113.79 MiB |
| ptop 0.1.2 | 7.50 MiB | 6.74–8.36 MiB |
RSS measures the monitor process only; sensor children are excluded. The range is across each run's average RSS, not the lowest and highest individual memory sample.
Against vtop, ptop's median was 93.3% lower for own-process RSS and 16.1% lower for CPU. Those percentages use the unrounded medians. Against htop and btop, the CPU result points the other way: both consumed substantially less CPU. If low CPU overhead is your priority, these measurements favor htop.
The versions tested were htop 3.2.2, btop 1.4.7, vtop 0.6.1, and ptop 0.1.2. These are the actual executables available for this experiment, not a claim that every one is the newest upstream release.
How the comparison works
The machine was an Apple M2 Max, 12 logical CPUs, 96 GiB RAM, macOS 15.4.1. Each tool ran four times for 30 seconds in an owned 100 × 30 pseudo-terminal. I requested a 1,000 ms interface refresh from each tool and rotated the order so every tool occupied every position once.
The monitors have separate temporary configurations. ptop runs in its normal mode, without --vtop-parity or --fix. vtop and ptop use the parallax theme with mouse input disabled. htop and btop retain their own layouts and collection behavior; this is not a feature-for-feature rendering test.
The requested interface refresh is a shared setting, not proof of equal sensor work. vtop and ptop retain their internal sensor schedules, and btop displays disk and network information the dotted monitors do not. The experiment report contains the tool-specific commands and configuration.
CPU is elapsed-lifetime user plus system CPU time, including startup, graceful shutdown, and sensor children reaped by the monitor. A value of 100% means one fully occupied CPU core. These are external measurements of the monitor's overhead, not the system CPU numbers shown inside its interface.
Memory is the monitor process's own resident set size, sampled approximately every 100 ms after its first terminal output. It excludes sensor children and is not a whole-process-tree or macOS physical-footprint measurement. Each run has a mean RSS; the table summarizes those run means.
This is a short experiment on one working Mac. Background activity and the live process list can change. It doesn't establish Linux rankings, long-running memory behavior, or a universal winner. Four repetitions show some variation, but they do not remove those limits.
Download the evidence or run it yourself
The raw JSONL measurements are downloadable without an account. The full report and Python harness are public too.
Use an Apple Silicon Mac running macOS 15 or later with Python 3.11 or newer, htop, and btop installed. This example installs the tested ptop and vtop releases, then checks out the harness. The experiment used htop 3.2.2 and btop 1.4.7; your package manager may install other versions, which will be recorded in your results.
npm install -g @patebryant/ptop@0.1.2 vtop@0.6.1
git clone https://github.com/patebry/ptop.git
cd ptop
git checkout 63d0403
python3 scripts/compare_monitors.py \
  --ptop "$(command -v ptop)" \
  --vtop "$(command -v vtop)" \
  --htop "$(command -v htop)" \
  --btop "$(command -v btop)" \
  --seconds 30 --repetitions 4 --cols 100 --rows 30 \
  > terminal-monitors.jsonl
The script records versions and executable hashes and rejects incomplete runs. Check its exit status before treating the output as valid. It drains and discards terminal output, so the results don't contain your process names or command lines. For reproducibility, retain the vtop dependency lockfile as well: a launcher hash does not identify its entire Node dependency tree.
See BENCHMARKING.md for prerequisites, exact accounting, and the separate historical ptop/vtop experiment.
Installing on macOS or Linux
For htop and btop, start with the htop installation documentation and btop installation documentation. Both support macOS and Linux; package availability and versions depend on your package manager.
For vtop, install Node.js and follow the upstream npm instructions:
npm install -g vtop
vtop
For ptop on Apple Silicon macOS 15 or later, use the prebuilt npm package:
npm install -g @patebryant/ptop@0.1.3
ptop
This installs the optimized 0.1.3 release. Restart any existing ptop session after upgrading. The reproduction command above deliberately pins 0.1.2 to match the earlier four-tool experiment.
For ptop on Linux, install Rust 1.92.0 and the usual ps, free, hostname, and killall tools, then build from source:
cargo install --git https://github.com/patebry/ptop --locked
ptop
The ptop npm package contains only the macOS ARM64 binary. Linux builds and terminal checks run in Ubuntu CI, but this article's performance measurements are macOS-only. Intel Mac source builds and every Linux distribution/architecture combination have not been verified.
If you're already happy with htop or btop, there is no need to switch because I wrote another monitor. If what you want is vtop's familiar screen with a Rust implementation, ptop's source and npm package are there to try.